Refractive Surgery Outcomes: Standard Graphs for Reporting Refractive Surgery
In a specialist medical sector like refractive surgery, publishing outcomes of each surgical procedure offers valuable insight to surgeons, researchers, and patients alike. These figures are even more valuable when outcomes are directly comparable across different publications. For example, for decades now, many peer-reviewed journals have strictly adhered to a universal standard or format for reporting refractive surgery outcomes. As a result, outcomes from different surgeons, clinics, and countries can be directly compared more easily.
This uniformity goes back over 20 years to when George O. Waring III – in association with the editorial staff at the Journal of Refractive Surgery and the Journal of Cataract and Refractive Surgery – published an article titled: “Standard Graphs for Reporting Refractive Surgery”1.
This article set out a concise six-graph format for reporting the clinical outcomes of refractive surgery, covering four main areas: accuracy, efficacy, safety and stability.
Developments of Standard Graphs for Reporting Refractive Surgery protocol
In November 2009 – almost a decade after Waring first published has article on the subject, he co-authored an editorial with Professor Dan Reinstein outlining a number of improvements and reiterating the importance of adhering to the protocol. The editorial was published in the Journal of Refractive Surgery2.
In January 2011, a joint editorial was published in the Journal of Refractive Surgery,3 the Journal of Cataract and Refractive Surgery4 and Cornea5 in which some final amendments were made to the graphs. This final editorial also outlined the commitment of these three journals to ensure authors report their outcomes with a minimum standard of displaying the six standard graphs for datasets that lend themselves to this format of reporting.
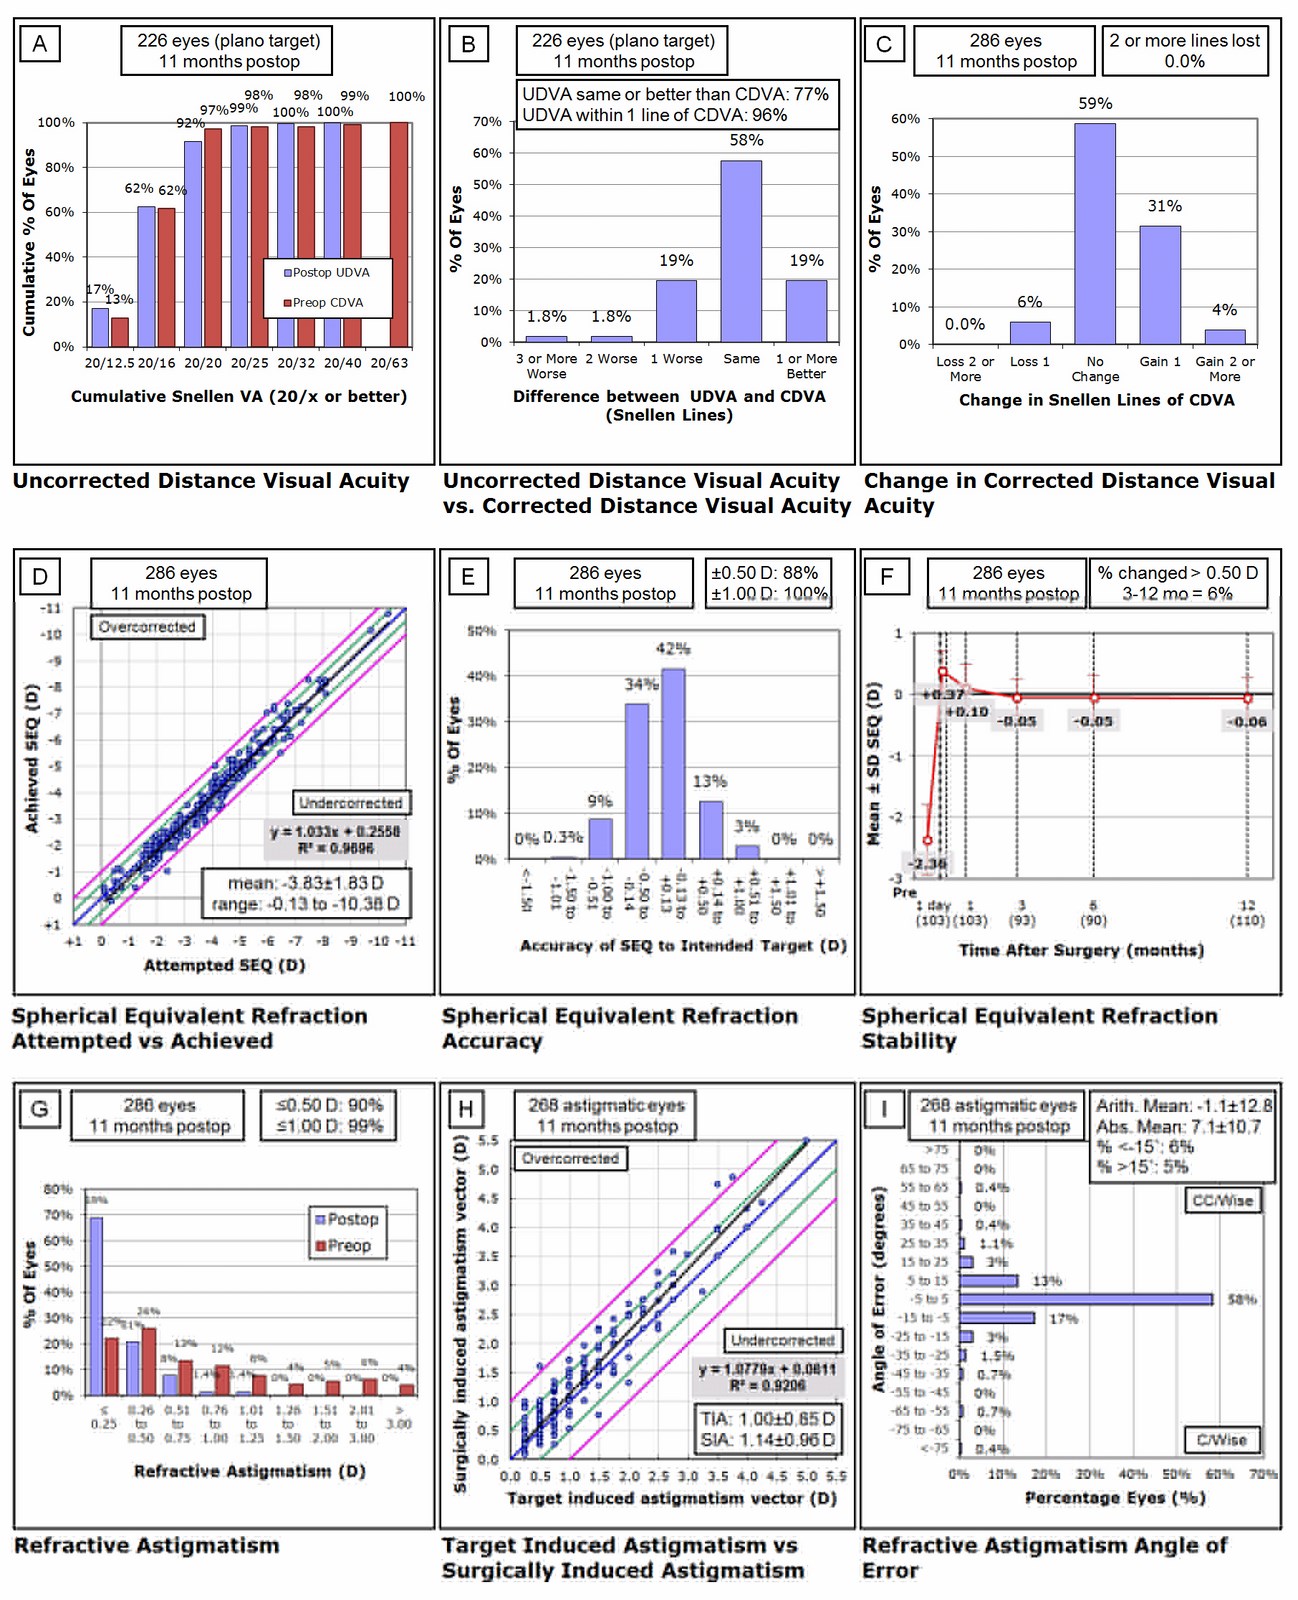
By the end of 2014, the standard six graphs was expanded to nine. This was to account for further information regarding the correction of astigmatism, as set out in an editorial in the Journal of Refractive Surgery authored by Prof Reinstein, Timothy J. Archer, and J. Bradley Randleman.6
The figure shown here demonstrates the Standard Graphs for Reporting Refractive Surgery for an example population. An example of the Standard Graphs are now published in virtually every issue of JRS. These graphs can be easily generated using standard spreadsheet software programs such as Microsoft Excel, as well as other software programs designed specifically for refractive surgery outcomes analysis.
You can find an Excel template which can be used to produce the nine required graphs by clicking below:
We believe that continued efforts to improve the rigour of reporting refractive surgery outcomes are essential. Not only does this help us maintain an incredibly high safety and efficacy standard, but it allows us to continually improve on our already impressive outcomes.
References
- Waring GO, 3rd. Standard graphs for reporting refractive surgery. J Refract Surg. 2000;16(4):459-466. Erratum in: J Refract Surg. 2001;2017:following table of contents.
- Reinstein DZ, Waring GO, 3rd. Graphic Reporting of Outcomes of Refractive Surgery. J Refract Surg. 2009;25(11):975-978.
- Waring GO, 3rd, Reinstein DZ, Dupps WJ, Jr., Kohnen T, Mamalis N, Rosen ES, Koch DD, Obstbaum SA, Stulting RD. Standardized graphs and terms for refractive surgery results. J Refract Surg. 2011;27(1):7-9.
- Dupps WJ, Jr., Kohnen T, Mamalis N, Rosen ES, Koch DD, Obstbaum SA, Waring GO, 3rd, Reinstein DZ, Stulting RD. Standardized graphs and terms for refractive surgery results. J Cataract Refract Surg. 2011;37(1):1-3.
- Stulting RD, Dupps WJ Jr, Kohnen T, Mamalis N, Rosen ES, Koch DD, Obstbaum SA, Waring GO 3rd, Reinstein DZ. Standardized graphs and terms for refractive surgery results. Cornea. 2011 Aug;30(8):945-7.
- Reinstein DZ, Archer TJ, Randleman JB. JRS standard for reporting astigmatism outcomes of refractive surgery. J Refract Surg. 2014 Oct;30(10):654-9.